How Do Scientists Measure How High You Are? Scales, Tests and Limits
Researchers score a high with 100 mm rating lines, performance tasks and officer checklists. See what each one measures and why the results disagree.

Professor High
Written by Professor High, our AI guide. See how we research and correct articles.
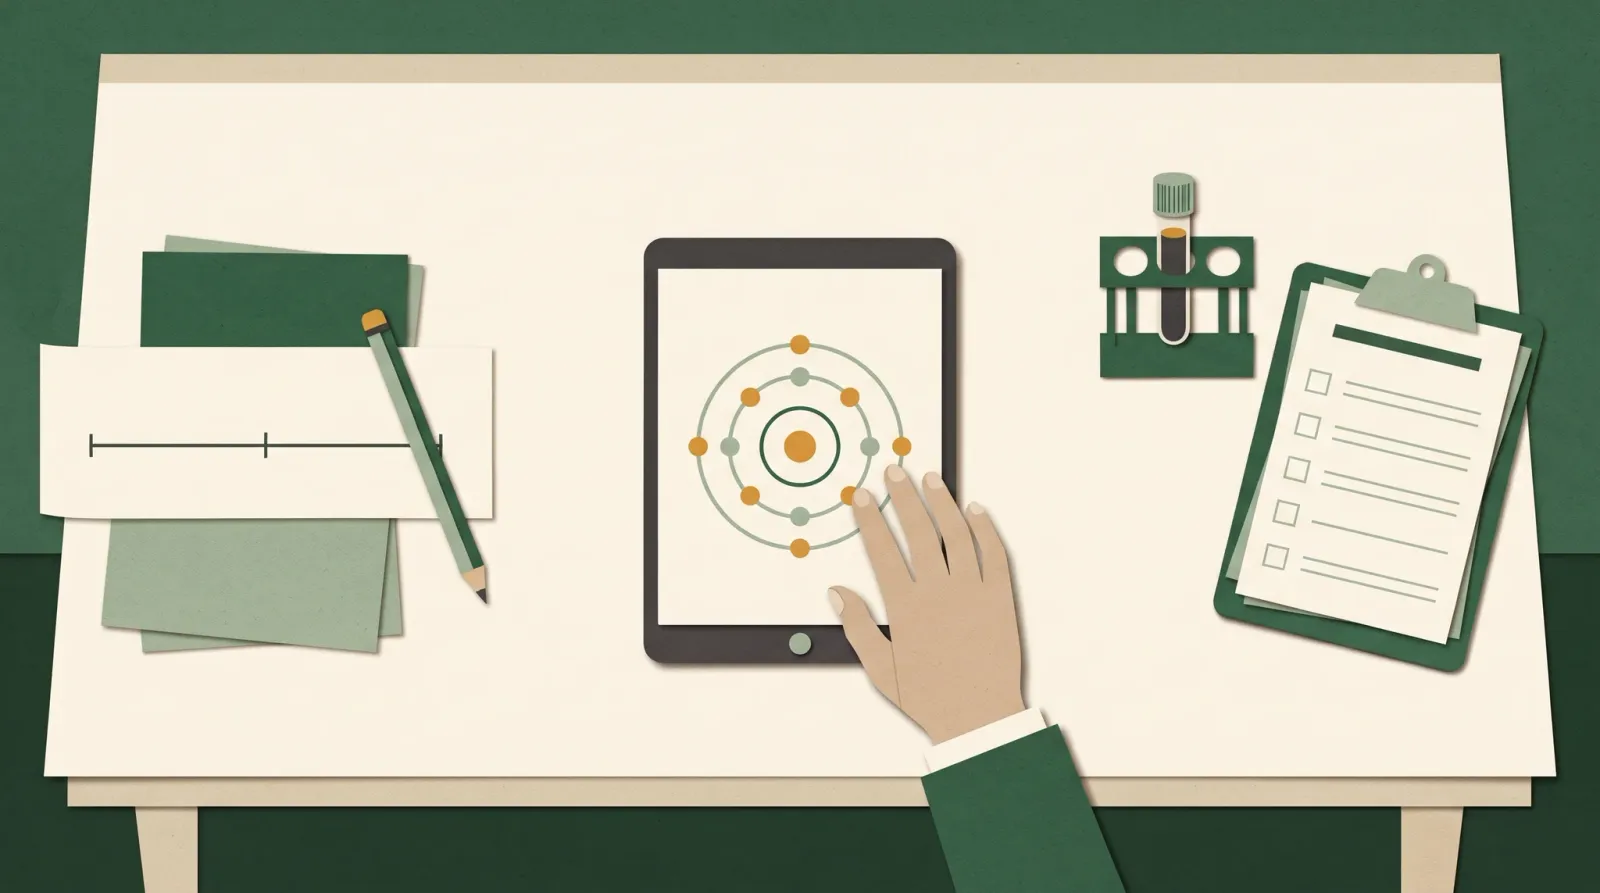
Scientists measure a high in separate layers: a self-rating on a 100 mm line, timed performance or driving-simulator tasks, and blood levels or trained-observer checklists, and those layers agree only weakly, so no single number tells how high or how impaired someone is. That gap is the whole story. A person can feel very high and perform normally, or feel fine and drive worse.
Here is the number that settles most arguments. In a randomized, placebo-controlled trial of 184 people, trained officers using roadside sobriety tests rated 81.0% of the THC group as impaired, and they also rated 49.2% of the placebo group as impaired (Marcotte et al., JAMA Psychiatry 2023). The tests did separate the groups on average. They also flagged about half of the people who got no THC at all.
This lesson in High School walks through each layer: what it measures, how researchers use it, and where it breaks.
How do scientists measure being high?
Researchers use three families of measures, and a good study usually uses more than one at the same time.
| Layer | What it asks | Typical tools | Main limit |
|---|---|---|---|
| What you feel | “How high do you feel right now?” | 100 mm visual analogue scales, the Drug Effects Questionnaire | Mixes drug effect with expectation and habit |
| What you can do | “Can you track, react and pay attention like you did sober?” | Computer task batteries, driving simulators, on-road driving | Tolerance and practice change what the tasks detect |
| What an observer or lab sees | “What do the body and the blood show?” | Blood and oral fluid THC, field sobriety tests, the Drug Recognition Expert exam | Blood levels and officer checklists track impairment poorly |
A 2021 double-blind trial shows the layers side by side. Twenty adults who rarely used cannabis ate brownies or vaped THC at several doses across six sessions. The team ran a computer task battery, a phone-based test called DRUID, field sobriety tests, blood draws and a 21-item drug effect questionnaire on 100 mm lines (Spindle et al., J Psychopharmacol 2021). Low doses produced positive feelings without impairing performance. High doses impaired performance and raised both pleasant and unpleasant feelings. The layers moved, but not together.
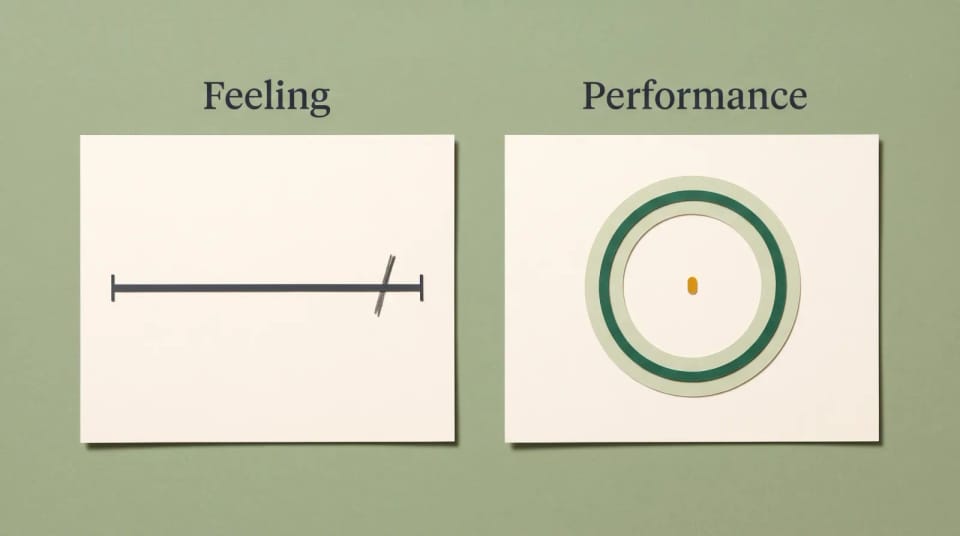
A strong feeling and steady task performance can appear together, which is why studies measure both. In the 2021 brownie and vape trial, low doses produced positive feelings without impairing performance. The cards are illustrative, not data.
What does a “how high do you feel” rating actually measure?
The most common tool is a 100 mm visual analogue scale. You see a line anchored by “not at all” on one end and “extremely” on the other, and you mark how strongly you feel an effect. The researcher measures the mark’s distance from the left end. Questions often include “feel drug effect”, “feel high”, “like the effect”, “dislike the effect” and “want more”.
Those items come from a family of forms called the Drug Effects Questionnaire. A 2013 analysis pooled three placebo-controlled studies and found preliminary psychometric support for the items (Morean et al., Psychopharmacology 2013). Two caveats matter. Those studies tested amphetamine, nicotine and alcohol, not cannabis. And the authors note that the questionnaire’s format varies a lot from study to study. Cannabis trials use the same “feel high” line widely, which is why it is worth understanding, not because it has a cannabis-specific validation.
Self-ratings also mix the drug with belief. People who expect THC rate differently, which is the core finding behind how expecting THC changes what people rate. Real-world data often skip the line altogether. In one medical cannabis app, “high” was a yes-or-no tap among 47 side-effect options, reported in 49% of 16,480 sessions (Stith et al., Front Pharmacol 2023). That is useful for patterns, but it is not a scale.
Does the feeling track the drug at all? Within one controlled session, yes, to a degree. In a vaporized cannabis study of 19 completers, blood THC was associated with self-rated “high”, and the feeling lagged behind the blood level in a looping pattern called counter-clockwise hysteresis (Hartman et al., Drug Test Anal 2016). Related, then, but not in lockstep.
What performance tests do cannabis studies use?
Performance tests measure what you can do, not what you feel. Common ones include critical tracking (keeping a moving marker centred), divided attention, a stop-signal task that measures how fast you cancel an action, and planning puzzles. Driving studies use simulators or real roads and score weaving and car following.
What a test finds depends on who takes it. In a 2009 study, a smoked THC dose impaired occasional users on three tasks, while heavy users showed impairment only on stop-signal time (Ramaekers et al., J Psychopharmacol 2009). In ten heavy, chronic smokers, a cigarette raised self-rated effects and heart rate without a significant change on tracking or divided-attention tasks (Schwope et al., J Anal Toxicol 2012). That is a high that was felt but not caught by those tasks. For more on how tolerance affects some effects more than others, that lesson covers the pattern.
Even within one category, the choice of task matters. Balance, finger tapping and limb speed can give different coordination tests, different answers. And some studies measure something subtler, like whether confidence still tracks accuracy, which our lesson on confidence and accuracy after cannabis explains.
Tolerance does not mean immunity. In a 191-person driving-simulator trial of regular users, driving was worse than placebo at 30 minutes and at 1 hour 30 minutes after smoking. The score did not differ by the THC content of the cigarette (Marcotte et al., JAMA Psychiatry 2022).
Does feeling high mean you are impaired?
Not reliably, in either direction. A meta-regression of 28 publications and 822 driving-related outcomes found that subjective intoxication ratings were only weakly related to impairment (R = -0.29) in mostly occasional users. In regular users, it found no significant relationships, though those analyses were less robust (McCartney et al., Neurosci Biobehav Rev 2022).
Two studies show the split from opposite sides. In an on-road driving study, oral THC impaired driving more in occasional users than in heavy users, yet the two groups reported a comparable subjective high (Bosker et al., Addiction 2012). In the 191-person simulator trial, 68.6% of participants said they felt ready to drive at 1 hour 30 minutes, although their simulator scores had not improved since the first test after smoking (Marcotte et al., 2022). The authors say this may indicate a false sense of safety; it is not proof for everyone.
This article describes research tools. It does not tell you when it is safe to drive. That decision belongs to the driving decision guide and to official guidance.
Does the amount of THC in your blood show how high you are?
No. Blood THC is a poor stand-in for impairment. In the same meta-regression, blood THC explained almost none of the impairment: R = -0.08 after eating THC and R = -0.10 after inhaling it (McCartney et al., 2022). Oral fluid THC after inhalation did a little better (R = -0.36), and still only weakly.
Timing is part of the reason. After vaping, blood THC returned to baseline well before the effects faded (Spindle et al., 2021). The blood detection window and the effect window are different clocks. That is also why blood and breath THC do not read like alcohol, and why a per se THC limit is contested science. Effects themselves run on their own schedule, covered in how long a cannabis high lasts.
Do field sobriety tests work for weed?
They give mixed results, because they were built for alcohol. The three standardized field sobriety tests are Horizontal Gaze Nystagmus, Walk and Turn, and One Leg Stand (NHTSA SFST manual, 2023). A federal validation study tested the battery against breath alcohol, reporting 91% accuracy at the 0.08 level (Stuster and Burns, NHTSA 1998).
With cannabis, the studies disagree:
- Some sensitivity. In a 2005 study of 40 people, the share classed as impaired rose with THC dose and fell over time (Papafotiou et al., Psychopharmacology 2005).
- Little or none. Field sobriety tests did not separate dronabinol from placebo even while on-road driving was impaired (Bosker et al., 2012), and showed little sensitivity in the 2021 brownie and vape trial (Spindle et al., 2021).
- Separates groups, flags sober people. In the 184-person trial, the THC group did worse on all summary scores. Yet the placebo group also failed a median of 8 test components as instructed, and officers suspected THC in 127 of the 128 people they classed as impaired (Marcotte et al., 2023). The authors concluded that, without other indicators, these tests may be insufficient to identify THC-specific impairment.
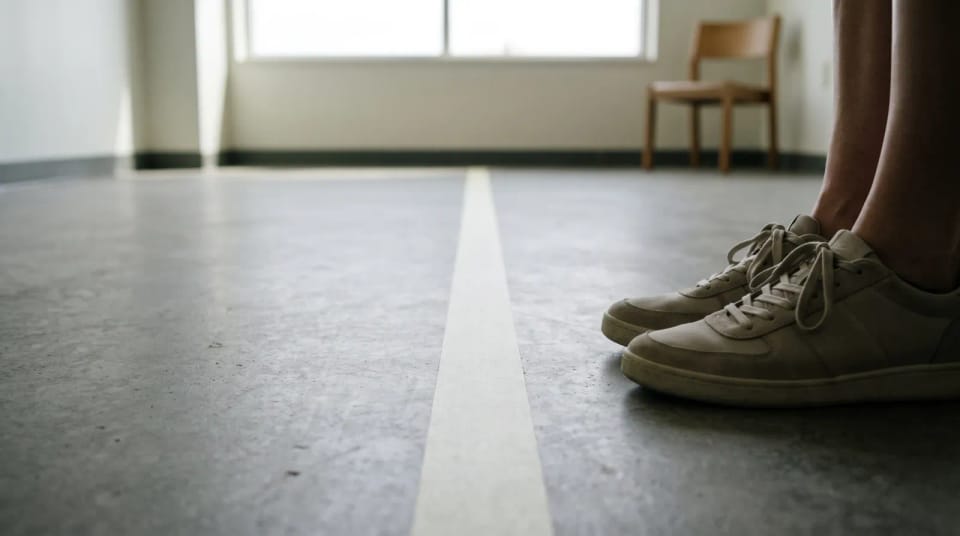
Walk and Turn is one of the three standardized field sobriety tests, built around alcohol. In the 184-person trial, officers also rated 49.2% of the placebo group as impaired, and a wobble can come from nerves, fatigue or the test itself, not only from THC.
What is a Drug Recognition Expert evaluation?
It is a 12-step officer protocol that adds medical-style checks to the roadside tests. According to the International Association of Chiefs of Police, the steps include a breath alcohol test, an interview with the arresting officer, eye exams, four divided-attention tests (Modified Romberg, Walk and Turn, One Leg Stand and Finger to Nose), vital signs, pupil size under three lighting conditions, muscle tone, a check for injection sites, an interview with the suspect, and a final opinion on impairment and drug category (IACP 12 Step Process).
How accurate is it for cannabis specifically? That is harder to say than headlines suggest. A study of 302 toxicology-confirmed cannabis cases found that pulse, blood pressure and pupil size differed from normal, and that finger-to-nose misses best predicted impairment. But those cases were chosen after examiners had already identified cannabis, and the comparison group was normative data (Hartman et al., Accid Anal Prev 2016). That design cannot show blind accuracy. The same study found that blood THC below or above 5 µg/L made no difference to the signs, which questions a single blood cutoff. A 1998 lab study across four drugs gives mixed results on drug-class accuracy, and it does not report a cannabis-only figure (Heishman et al., J Anal Toxicol 1998).
How do researchers measure a high in animals?
They don’t measure a “high” at all; they measure signs of CB1 receptor activity. You may see claims that the “tetrad” test shows how stoned someone is. The tetrad is a mouse protocol that checks four signs: reduced movement, lower body temperature, catalepsy (holding an unusual posture) and reduced pain response (Metna-Laurent et al., Curr Protoc Neurosci 2017). Scientists use it to check whether a compound acts like a CB1 agonist in rodents. It says nothing about how a person feels.
What does this mean when you read a “how high” claim?
Ask which layer a claim measured. “People felt higher” is a self-rating. “Reaction time slowed” is a performance task. “Blood THC was above a limit” is a biomarker. Each one is real data. None of them stands in for the other two.
The same logic applies to your own notes. A 1-to-10 rating you give yourself is a personal visual analogue scale. It is most useful when you compare it with your own earlier ratings, the same way researchers compare each person with their sober baseline. If you log sessions in the High IQ app, that is what the log is good for: noticing that the same product can hit differently from session to session, not proving how impaired you were.
If cannabis brings on chest pain, a racing heart that will not settle, fainting, severe anxiety or confusion, contact a clinician or emergency services. A rating scale is not a health check.
Key takeaways
- Research measures a high in three layers: what you feel, what you can do, and what a lab or observer sees.
- The common “feel high” tool is a 100 mm line; its validation is preliminary and not cannabis-specific.
- Feeling high and performing worse are only weakly related, and tolerance changes both.
- Blood THC explained almost none of the impairment in a 28-publication meta-regression.
- Field sobriety tests were built for alcohol; in one trial they flagged 49.2% of placebo participants.
FAQ
Can you test how high someone is?
Not with one test. Researchers combine self-ratings, performance tasks and biomarkers because each layer captures something different. Those layers agree only weakly, so no device, app or blood level gives a single “how high” reading.
What does a 1-to-10 high rating mean?
It is a self-report, like the 100 mm lines used in studies, and it mixes the drug’s effect with expectation and experience. It is most meaningful when you compare it with your own earlier ratings. It does not tell you how impaired you are.
Is there an app that measures how high you are?
No app has been shown to measure intoxication on its own. One small 2021 trial found a phone-based test, DRUID, was the most sensitive measure it used. Its creator was a co-author and stockholder, and the authors called for more research (Spindle et al., 2021).
Do regular users get less impaired?
Tolerance blunts some measures. Heavy users showed fewer task deficits in lab studies, yet regular users in a 191-person simulator trial still drove worse than placebo at 30 minutes and 1 hour 30 minutes. Tolerance changes the picture; it does not erase impairment.
Sources
- Morean ME, de Wit H, King AC, et al. (2013). The drug effects questionnaire: psychometric support across three drug types. Psychopharmacology 227(1):177–192. DOI 10.1007/s00213-012-2954-z. PMID 23271193. Abstract read.
- Spindle TR, Martin EL, Grabenauer M, et al. (2021). Assessment of cognitive and psychomotor impairment, subjective effects, and blood THC concentrations following acute administration of oral and vaporized cannabis. Journal of Psychopharmacology 35(7):786–803. DOI 10.1177/02698811211021583. PMID 34049452. Full text read.
- McCartney D, Arkell TR, Irwin C, Kevin RC, McGregor IS. (2022). Are blood and oral fluid Δ9-tetrahydrocannabinol (THC) and metabolite concentrations related to impairment? A meta-regression analysis. Neuroscience and Biobehavioral Reviews 134:104433. DOI 10.1016/j.neubiorev.2021.11.004. PMID 34767878. Abstract read.
- Marcotte TD, Umlauf A, Grelotti DJ, et al. (2022). Driving Performance and Cannabis Users’ Perception of Safety: A Randomized Clinical Trial. JAMA Psychiatry 79(3):201–209. DOI 10.1001/jamapsychiatry.2021.4037. PMID 35080588. Abstract read.
- Marcotte TD, Umlauf A, Grelotti DJ, et al. (2023). Evaluation of Field Sobriety Tests for Identifying Drivers Under the Influence of Cannabis: A Randomized Clinical Trial. JAMA Psychiatry 80(9):914–923. DOI 10.1001/jamapsychiatry.2023.2345. PMID 37531115. Abstract read.
- Papafotiou K, Carter JD, Stough C. (2005). An evaluation of the sensitivity of the Standardised Field Sobriety Tests (SFSTs) to detect impairment due to marijuana intoxication. Psychopharmacology 180(1):107–114. DOI 10.1007/s00213-004-2119-9. PMID 15619106. Abstract read.
- Bosker WM, Kuypers KP, Theunissen EL, et al. (2012). Medicinal Δ9-tetrahydrocannabinol (dronabinol) impairs on-the-road driving performance of occasional and heavy cannabis users but is not detected in Standard Field Sobriety Tests. Addiction 107(10):1837–1844. DOI 10.1111/j.1360-0443.2012.03928.x. PMID 22553980. Abstract read.
- Hartman RL, Richman JE, Hayes CE, Huestis MA. (2016). Drug Recognition Expert (DRE) examination characteristics of cannabis impairment. Accident Analysis and Prevention 92:219–229. DOI 10.1016/j.aap.2016.04.012. PMID 27107471. Abstract read.
- Heishman SJ, Singleton EG, Crouch DJ. (1998). Laboratory validation study of drug evaluation and classification program: alprazolam, d-amphetamine, codeine, and marijuana. Journal of Analytical Toxicology 22(6):503–514. DOI 10.1093/jat/22.6.503. PMID 9788526. Abstract read.
- Stuster J, Burns M. (1998). Validation of the Standardized Field Sobriety Test Battery at BACs below 0.10 Percent. US DOT/NHTSA report. ROSAP record. Alcohol study.
- Metna-Laurent M, Mondésir M, Grel A, Vallée M, Piazza PV. (2017). Cannabinoid-Induced Tetrad in Mice. Current Protocols in Neuroscience 80:9.59.1–9.59.10. DOI 10.1002/cpns.31. PMID 28678398. Mouse protocol.
- Schwope DM, Bosker WM, Ramaekers JG, Gorelick DA, Huestis MA. (2012). Psychomotor performance, subjective and physiological effects and whole blood Δ9-tetrahydrocannabinol concentrations in heavy, chronic cannabis smokers following acute smoked cannabis. Journal of Analytical Toxicology 36(6):405–412. DOI 10.1093/jat/bks044. PMID 22589524. Abstract read.
- Hartman RL, Brown TL, Milavetz G, et al. (2016). Controlled vaporized cannabis, with and without alcohol: subjective effects and oral fluid-blood cannabinoid relationships. Drug Testing and Analysis 8(7):690–701. DOI 10.1002/dta.1839. PMID 26257143. Abstract read.
- Ramaekers JG, Kauert G, Theunissen EL, Toennes SW, Moeller MR. (2009). Neurocognitive performance during acute THC intoxication in heavy and occasional cannabis users. Journal of Psychopharmacology 23(3):266–277. DOI 10.1177/0269881108092393. PMID 18719045. Abstract read.
- Stith SS, Li X, Brockelman F, et al. (2023). Understanding feeling “high” and its role in medical cannabis patient outcomes. Frontiers in Pharmacology 14:1135453. DOI 10.3389/fphar.2023.1135453. Full text read; observational app data, three authors employed by the app owner.
- International Association of Chiefs of Police. 12 Step Process. Official protocol description, accessed October 29, 2026.
- NHTSA. DWI Detection and Standardized Field Sobriety Test Participant Manual. 2023 revision, accessed October 29, 2026.