Measurement Uncertainty on Cannabis Lab Reports Explained
Learn what measurement uncertainty means on a cannabis COA, why tiny potency gaps may be meaningless, and how labs make calls near legal limits.

A cannabis lab report may print THC as 24.8% with no plus-or-minus sign anywhere nearby. That tidy decimal looks exact. It is not.
Every measurement carries uncertainty. The scale, calibration, extraction, instrument, and sample prep all contribute. Cannabis adds another problem. One pinch of flower may not represent a mixed batch.
That does not make lab testing useless. It means a result is an informed estimate—not a molecule-by-molecule inventory. Once you understand that distinction, you can stop treating a 0.4-point potency gap like a scientific knockout.
Professor High’s short version: read the reported value, look for its uncertainty and units, ask whether the product and methods are comparable, and resist ranking products by tiny differences. Start with our complete guide to reading cannabis lab results if the rest of the COA is unfamiliar.
What measurement uncertainty actually means
Measurement uncertainty describes the range of values that could reasonably fit a result under stated conditions. In plain English, the lab’s best estimate sits inside a range. Its width reflects known sources of variation.
Imagine a report says:
Total THC: 25.0% ± 1.2 percentage points (expanded uncertainty, k = 2)
The displayed interval is 23.8% to 26.2%. The 25.0% is still the lab’s reported result. The ±1.2 gives the interval’s width. Under suitable assumptions, a coverage factor near k = 2 often means roughly 95% coverage. The report should define its factor and interval. Do not add a confidence level that is not stated.
One unit trap is worth stopping for. ±1.2 percentage points around 25.0% means 23.8% to 26.2%. ±1.2% relative would be 1.2% of 25.0, or only ±0.3 percentage point. Those are not interchangeable.
Uncertainty is also not an accusation that the lab made a mistake. A competent laboratory estimates uncertainty because honest measurement has limits.

Why the plus-or-minus sign may be missing
Many retail COAs show only a point estimate. The absence of a printed ± value does not mean uncertainty is zero. A lab may keep its estimate in quality or method records without printing it beside each result. Reporting rules also differ by state, program, analyte, and purpose.
New York’s cannabis laboratory quality-system standard, for example, requires the system to address evaluation of measurement uncertainty. Federal hemp testing rules go further for their specific purpose: 7 CFR 990.25 requires laboratories determining total THC in hemp plants to estimate and report measurement uncertainty.
Those examples do not establish one universal retail-COA format. If a report omits uncertainty, you cannot reverse-engineer a defensible interval from its number of decimal places, a lab’s duplicate limit, or a different laboratory’s estimate. Ask the issuing lab what uncertainty applies to that method, matrix, and concentration range.
The testing date matters too. Analytical uncertainty at the time of testing does not cover chemistry that changes during months of storage. Read when a cannabis COA becomes too old and our cannabis storage guide as separate layers.
Repeatability and reproducibility are not twins
Two terms explain why a lab can look consistent internally while the wider market still disagrees.
Repeatability asks what happens when a lab repeats a test under nearly the same conditions. The method, equipment, operator setting, and time stay similar.
Reproducibility changes more conditions. It often compares labs, methods, instruments, operators, or times. It usually captures more variation.
NIST’s 2024 Cannabis Laboratory Quality Assurance Program Exercise 2 shows the difference. Most within-lab repeatability results met the cited AOAC criteria. Almost none of the between-lab reproducibility results did. NIST added an important limit: AOAC designed its between-lab test for labs using one method, but these labs used many. The study shows a comparison problem. It is not a scorecard that calls every lab bad [Yarberry et al., 2024].
Azwell and colleagues sent prepared hemp flower to ten accredited labs. One sample produced total-THC results from 0.27% to 0.59%. The results fell on opposite sides of a legal limit. Grinding and mixing reduced variation in another test. This was a small hemp study, not a forecast for every retail flower. Still, it shows how sampling and lab differences can change a legal call [Azwell et al., 2022].
This is why the chain of custody from sample to result and sample preparation matter. The instrument cannot correct a sample that never represented the batch.
Precision is not the same as accuracy
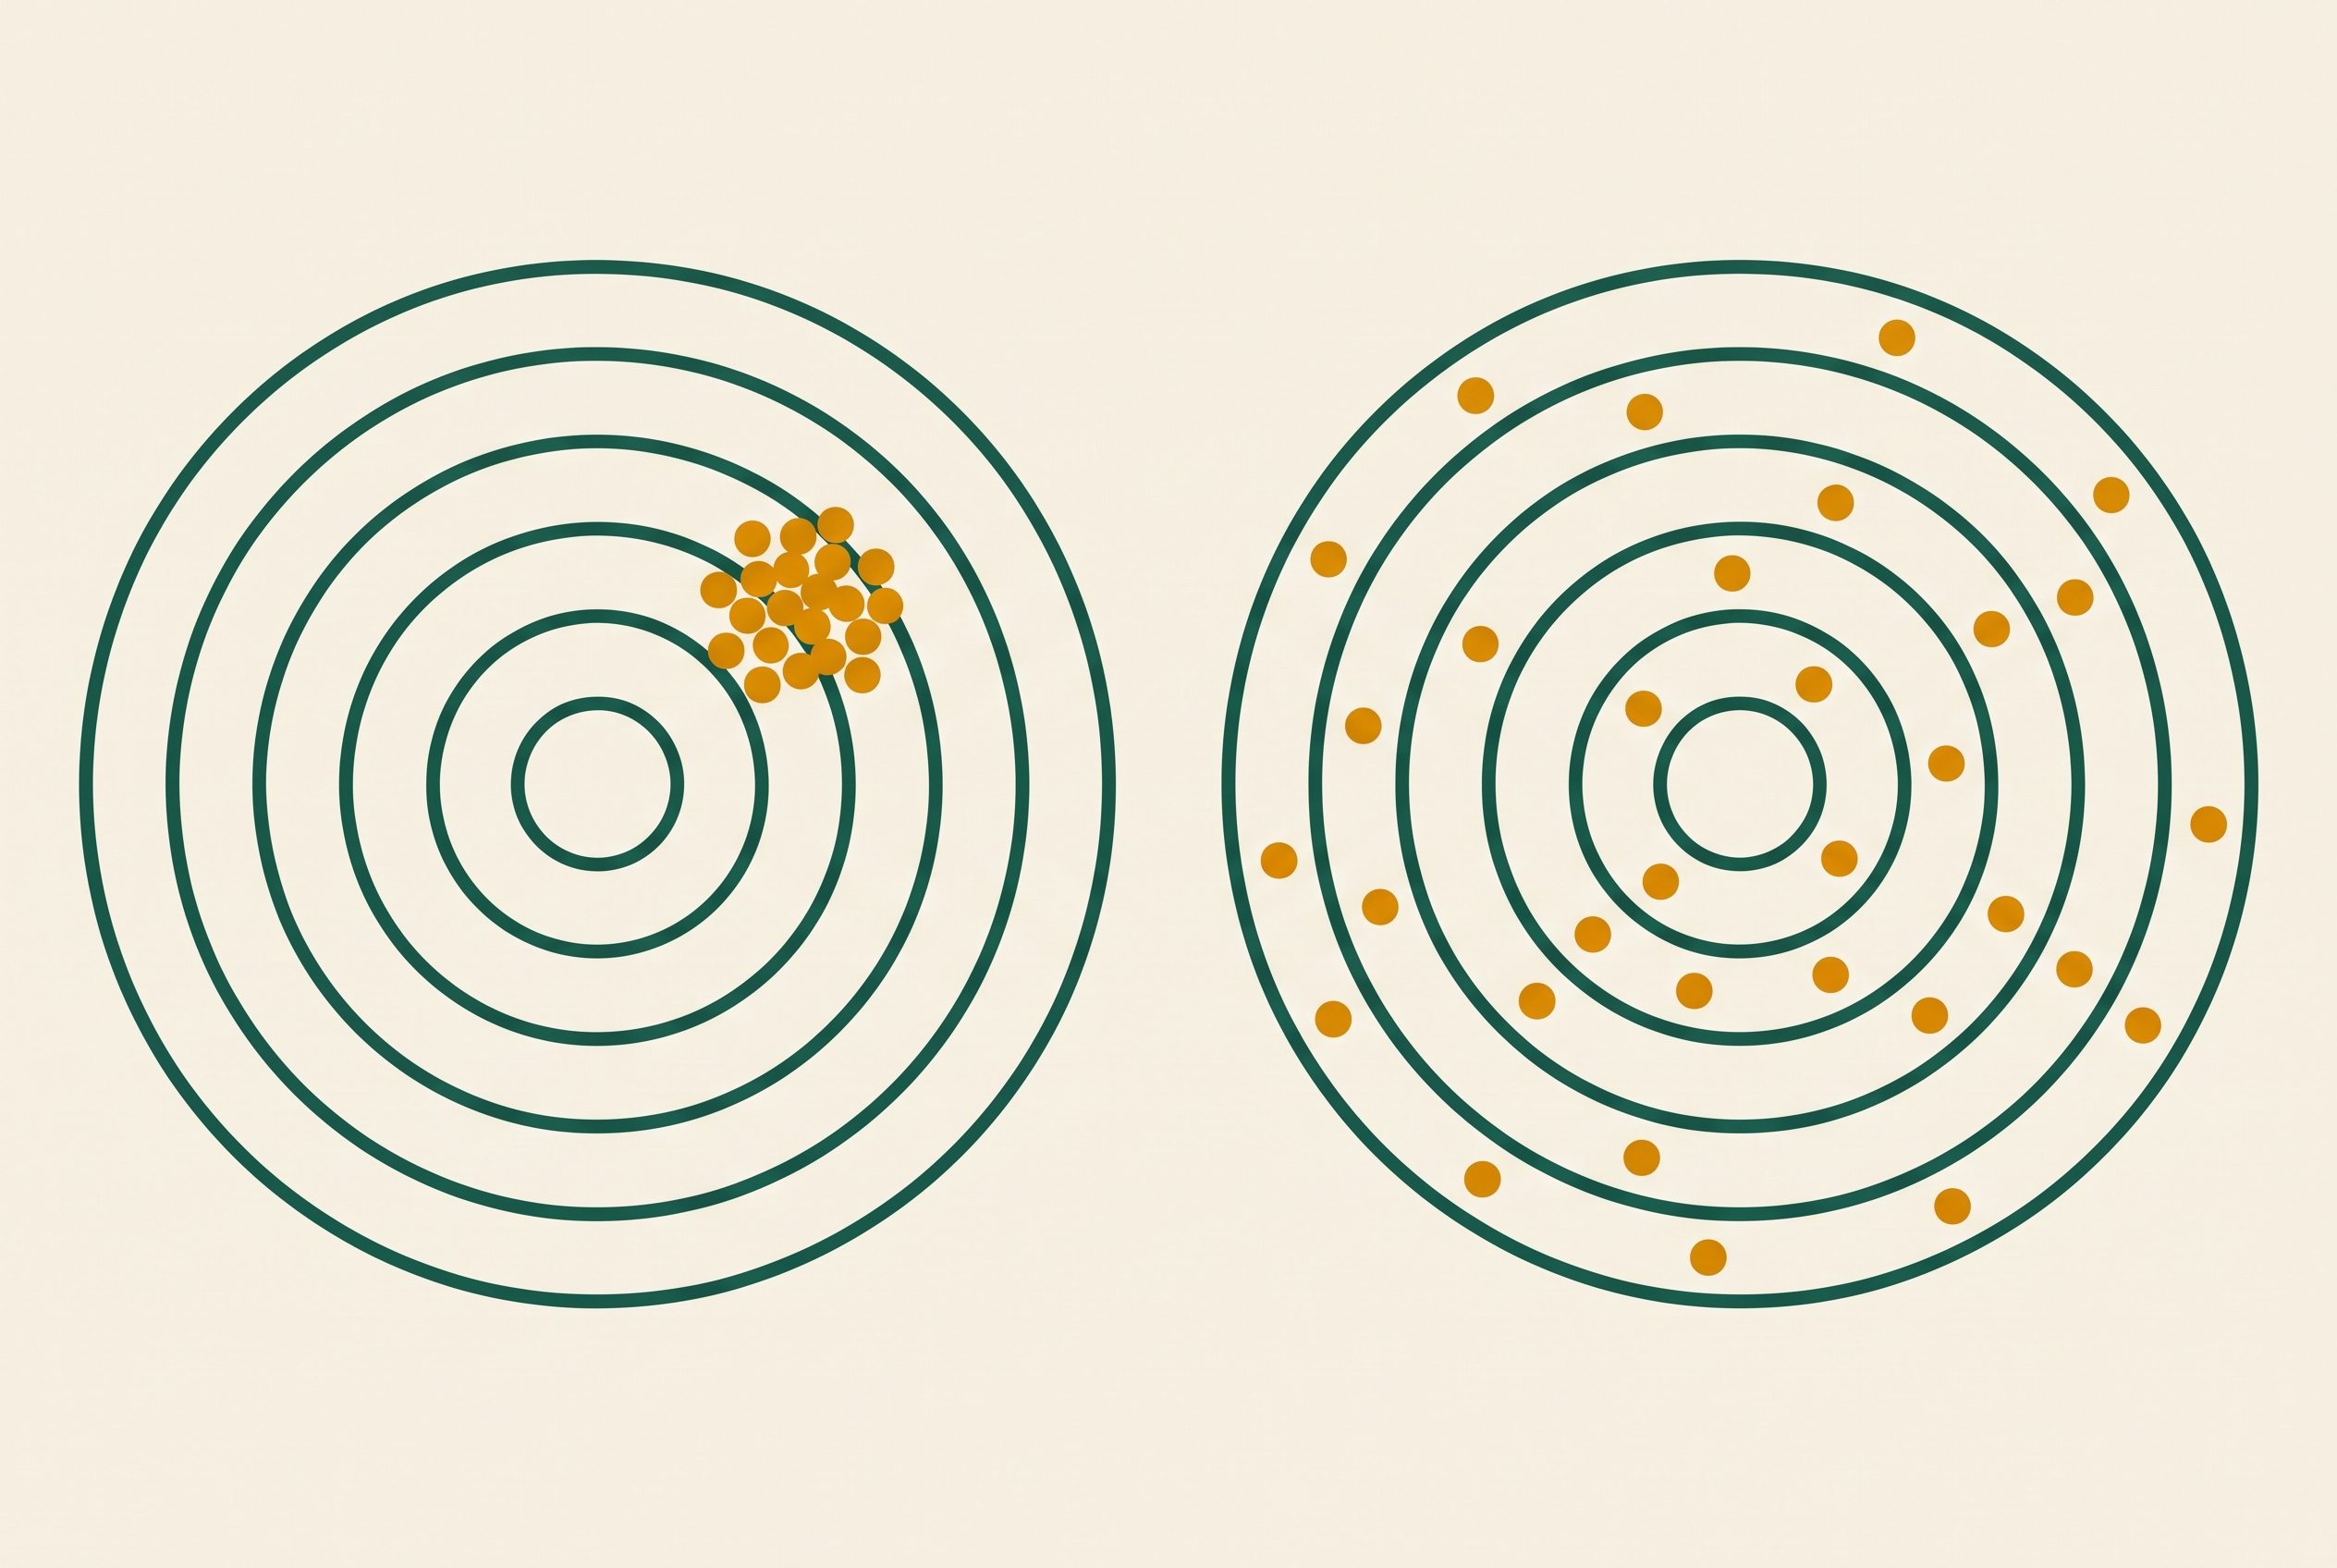
A tight group of results is precise. A result close to an accepted reference value is accurate. A biased method can hit nearly the same wrong place again and again.
Labs use calibration, controls, spikes, duplicates, skills tests, and reference materials to watch for these problems. NIST’s hemp reference material RM 8210 is a well-studied plant sample for method checks and quality control. Such materials help reveal bias. They do not make a complex sample uniform.
Do not convert a quality-control acceptance range into a product’s uncertainty. Washington’s cannabinoid rule, for example, includes recovery and relative-percent-difference criteria for controls and duplicates. A duplicate RPD limit is a check on analytical performance. It is not permission to print “±20%” beside every retail potency result.
California’s standard cannabinoid method for dried flower and plain pre-rolls shows another tool. One process can reduce differences between methods. Yet the rule allows proven instrument changes and calls for separate checks on other product types. A standard method can reduce variation. It cannot erase uncertainty or turn a flower method into an edible method.
Why tiny potency differences may be indistinguishable
Suppose two batch-matched flower COAs show:
| Product | Reported total THC | Hypothetical expanded uncertainty |
|---|---|---|
| A | 24.8% | ±1.5 percentage points |
| B | 25.2% | ±1.5 percentage points |
These invented values are for teaching, not a typical uncertainty claim. Product A’s interval would be 23.3% to 26.3%; Product B’s would be 23.7% to 26.7%. The intervals overlap heavily. The reports do not support confidently declaring B the more potent batch based on that 0.4-point gap.
Overlap is not a universal test. An uncertainty interval also does not make every value inside it equally likely. Without the uncertainty, coverage factor, method, sample type, sampling basis, and decision rule, an extra decimal cannot support a fine ranking.
The human experience is even less exact. Dose, inhalation pattern, tolerance, product freshness, cannabinoid profile, terpenes, and context all matter. Read why THC percentage is a terrible way to choose cannabis, why the same strain can hit differently, and our look at the THC potency arms race before paying extra for one decimal point.
This does not mean a 12% product and a 28% product are identical. It means small differences near the scale of the measurement’s uncertainty may not be distinguishable.
Decision rules near a legal limit
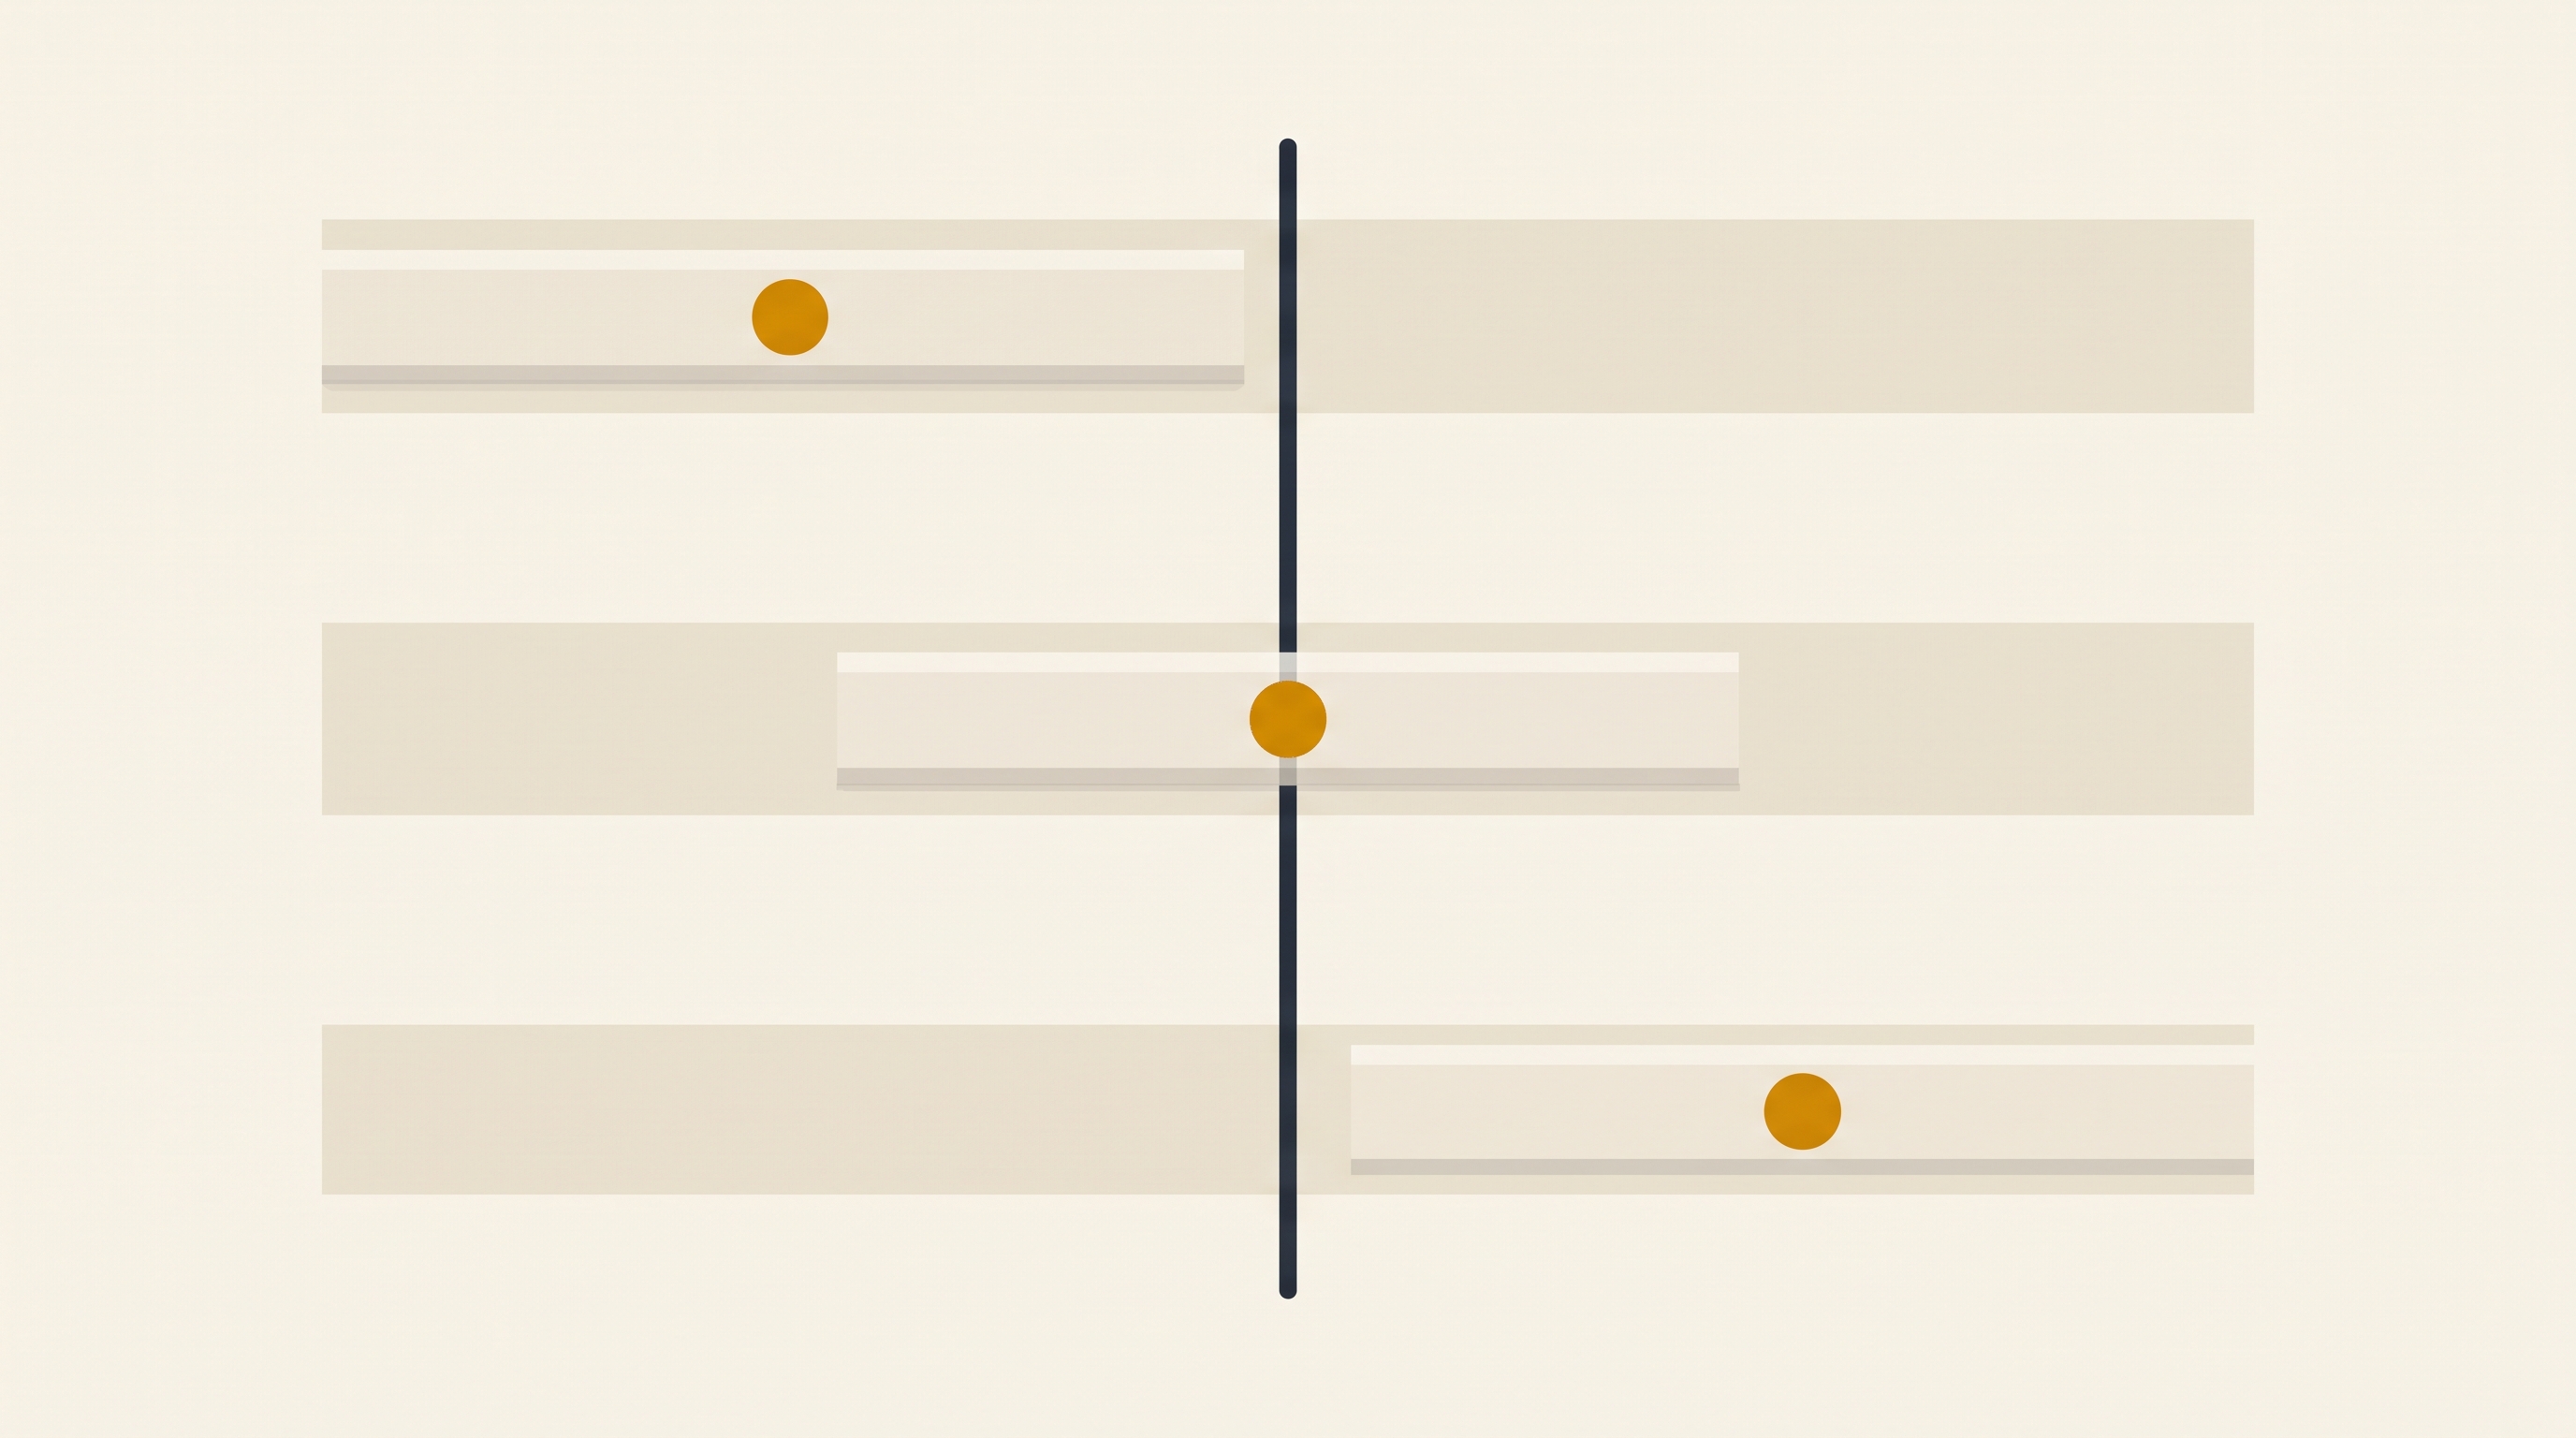
An uncertainty interval matters most near a limit. A decision rule says how the result, uncertainty, rounding, and legal cutoff lead to pass, fail, or another allowed outcome.
For a maximum limit, three conceptual cases are useful:
- Clearly below: the result and its relevant uncertainty interval sit below the limit.
- Clearly above: the result and interval sit above the limit.
- Overlapping the line: the interval crosses the limit, so the governing rule determines the conclusion.
That middle zone is where guard bands, retesting rules, statutory definitions, or “inconclusive” categories may matter. Laboratories and regulators must use the rule that applies. A consumer should not invent one.
USDA’s hemp laboratory guidance gives a concrete scope-specific example: laboratories testing hemp crop lots must calculate and report measurement uncertainty for total delta-9 THC on a dry-weight basis. A hypothetical hemp result of 0.32% ± 0.04 percentage point spans 0.28% to 0.36%. The federal hemp program’s own definitions and decision process govern what happens next.
That example is not a formula for judging a retail flower label. Hemp crop testing uses set sampling and dry-weight rules near a legal cutoff. It decides the fate of a crop. A retail claim near 25% THC may involve a different product, method, state, label rule, and sales question.
Sgrò and colleagues studied uncertainty for the EU’s official hemp THC method. They proposed a method-specific way to make calls near European limits. Their numbers belong to that method and legal setting. They are not a universal percentage for U.S. retail COAs [Sgrò et al., 2021].
What uncertainty does not include automatically
A laboratory’s stated uncertainty has a defined scope. Do not assume it covers every way reality can vary.
- Batch heterogeneity: one test portion may not capture every flower in a large batch.
- Sampling errors: who selected increments, from where, and how they were combined can dominate the answer.
- Identity failures: an excellent measurement attached to the wrong lot is still useless. Match the batch and inspect the sample custody trail.
- Post-test change: heat, light, oxygen, moisture, and time can alter the product after sampling.
- Unmeasured analytes: potency uncertainty says nothing about missing pesticides, microbes, solvents, or metals. Learn to read pesticide results separately.
- Your response: analytical uncertainty is not a prediction interval for how high, anxious, hungry, or sleepy you will feel.
These boundaries help explain why flower labels can overstate certainty and why some dispensary labels are misleading. The better response is not to ignore labs. It is to read their numbers at the precision the evidence supports.
A responsible consumer checklist
When two products look close on paper:
- Match the batch. Confirm product name, producer, lot, package identifier, dates, and laboratory.
- Find the uncertainty statement. Look for U, ±, coverage factor k, confidence or coverage language, and units.
- Do not manufacture a range. If uncertainty is absent, ask the lab; do not copy another report’s percentage.
- Compare like with like. Flower is not an edible, wet basis is not dry basis, and two methods may not be directly comparable.
- Treat small gaps cautiously. A few tenths of a percentage point rarely deserve a buying premium without supporting uncertainty data.
- Read the whole safety panel. Potency precision does not replace contaminants, freshness, or package integrity. Use our dispensary red-flag guide.
- Track your own outcomes. Your repeatable preference is often more useful than chasing the market’s highest number.
A trustworthy retailer should help you find the original batch report. Our dispensary buyer’s guide gives you the other questions worth asking.
Key takeaways
A cannabis result without a ± sign is still uncertain. Repeatability describes consistency under similar laboratory conditions; reproducibility expands the comparison across labs and methods. Expanded uncertainty communicates a range around the reported value, but only when its units, coverage factor, and scope are clear.
Tiny potency differences may be smaller than the measurement can distinguish. Near a legal limit, the correct decision comes from the governing program’s decision rule—not a homemade calculation. Federal hemp requirements are a useful case study, not a template for every retail cannabis claim.
Use our COA scanner to organize the report, compare products side by side, and save what you actually try. Then explore High Families to compare broader chemistry and experience instead of letting one decimal run the shopping trip.
Frequently asked questions
Does a missing ± sign mean the lab result is exact?
No. Every measurement has uncertainty. The lab may retain its estimate in method or quality-system records, or the reporting program may not require it beside every retail result. Ask for the method-specific uncertainty rather than assuming zero.
What does expanded uncertainty mean on a COA?
Expanded uncertainty is usually a combined standard uncertainty multiplied by a coverage factor, k. The lab should state the factor, units, and intended coverage. Without those details, a bare ± value is incomplete.
Is 25.2% THC definitely stronger than 24.8%?
Not from those numbers alone. Their uncertainty intervals may overlap, and sampling, matrix, method, storage, dose, and personal response also matter. A 0.4-point gap often supports less confidence than the decimal formatting suggests.
Are repeatability and reproducibility the same thing?
No. Repeatability examines results under nearly the same conditions inside a lab. Reproducibility examines results across changed conditions, often including different labs, methods, instruments, or operators.
Can I use the USDA hemp uncertainty rule to judge retail flower?
No. USDA’s rule applies to official hemp crop-lot compliance testing under a defined federal program. Retail cannabis labeling is governed by different state rules, matrices, methods, and decision questions. The general measurement principle transfers; the legal formula does not.
What should I do when a result is close to a legal limit?
Check the original report, its uncertainty statement, units, rounding, sample identity, and the current jurisdiction’s decision rule. The certified lab or regulator—not a consumer estimate—should make the compliance call.
Sources
- Yarberry, Phillips, and Wilson (2024), “Cannabis Laboratory Quality Assurance Program: Exercise 2 Cannabinoid Final Report,” National Institute of Standards and Technology.
- National Institute of Standards and Technology — Tools for Cannabis Laboratory Quality Assurance.
- Wilson et al. (2024), “Characterization of Reference Material 8210: Hemp Plant,” National Institute of Standards and Technology.
- New York Office of Cannabis Management — Laboratory Quality System Standard.
- USDA Agricultural Marketing Service — Hemp Laboratory Testing Guidelines.
- Electronic Code of Federal Regulations — 7 CFR 990.25.
- California Department of Cannabis Control — Standard Cannabinoid Test Method FAQ.
- Washington State Legislature — WAC 16-309-160: Cannabinoid Concentration Analysis.
- Azwell, Ciotti, Adams, and Pauli (2022), “Variation among hemp (Cannabis sativus L.) analytical testing laboratories evinces regulatory and quality control issues for the industry,” Journal of Applied Research on Medicinal and Aromatic Plants.
- Sgrò et al. (2021), “Delta9-THC determination by the EU official method: evaluation of measurement uncertainty and compliance assessment of hemp samples,” Analytical and Bioanalytical Chemistry.
Regulatory sources were checked August 22, 2026. Rules, methods, and reporting requirements change. This guide is educational and is not legal, medical, or laboratory-accreditation advice.